

Here we are with Part Two of my season review (you can see part one here). The first part was largely an overview of the team’s performance. In this part I’ll be exploring special teams and player usage–the two areas most impacted by coaching. As mentioned in Part One the BSens were awful on special teams (30th, aka last, and 28th respectively), and those struggles are related in part to player usage–something reflected in team performance. Let’s start with special teams and specifically the powerplay:
Powerplay (13.4%)
The BSens score 40 goals on the powerplay, heavily relying on their first unit (33-7 in goals scored). There was variation in performance throughout the season, although goals-scored remained steady:
October (9gp): 6-49 12.2%
November (13gp): 6-50 12.0%
December (12gp): 8-52 15.4%
January (12gp): 6-38 15.8%
February (12gp): 7-39 17.9%*
March (12gp): 5-47 10.6%
April (6gp): 2-24 8.3%
*all goals scored by Paul-Sexton with either White or Gagne as the third forward; Chlapik played the point (mostly with Harpur or Pokka)
When it comes to powerplay points, here are the leaders (GP noted to provide some context; prospects in green):
Chlapik 12-52
Paul 11-54
Sexton 9-30
White 9-47
Murray 8-58
DiDomenico 7-25
Jaros 7-44
Werek 7-58
Pokka 6-23
Chabot 5-13
Harpur 5-19
Lajoie 4-56
Burgdoerfer 4-66
Gagne 4-68
Perron 3-44
McCormick 3-49
O’Brien 3-60
Reinhart 3-67
Rodewald 2-62
Moutrey 1-16
Blunden 1-45
Sieloff 1-58
A more useful way to look at it is production per shift–as in, how many goals was the player on-ice for (I excluded small sample sizes) vs their usage (how often they played)? We’ll have separate graphs for forwards and defense to avoid visual clutter:
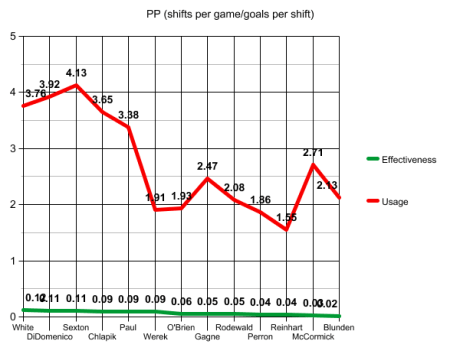
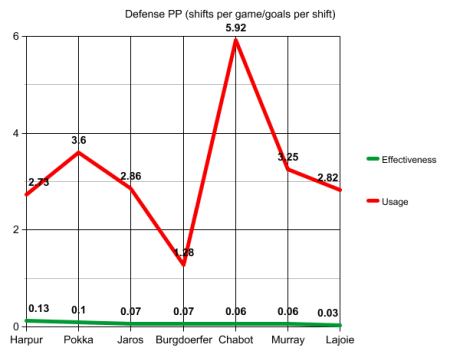
It’s a bit hard to see the variation with the forwards on the graph, but the trajectory gives you the idea. A few things are clear: prospects and talented vets (Sexton and DiDomencio) were the only productive forwards on the powerplay. On the D-side Chabot didn’t play many games (13), but I’ve included him because I know there’s a lot of interest. There aren’t many surprises on the D-side. How is this represented in terms of first/second line usage? Let’s look:
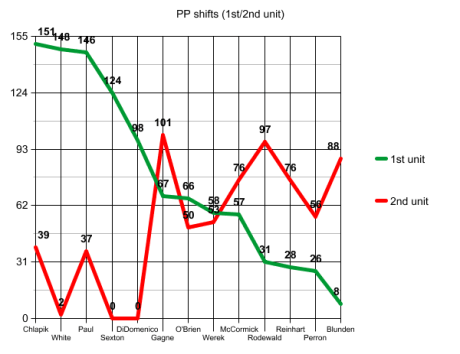
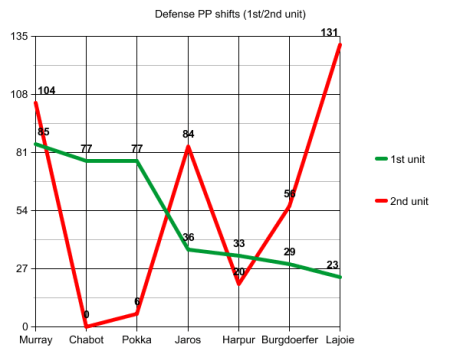
Clearly playing on the second unit hurts overall productivity, but who was on that unit is also part of the problem. What is a talented player like Max Lajoie supposed to do with a group of forwards like Blunden, Reinhart, and McCormick in front of him on the powerplay? You may have noticed, incidentally, that there proportionally fewer defense shifts for the first unit than there should be–the reason for this is as the season progressed Kleinendorst began putting forwards on the point (usually just one), thus cutting down on the first PP-time for blueliners on the top unit. As for the forwards, you’re left wondering: why were Chlapik and Paul ever on the second-unit? Why was Murray given so much top-unit time? Why stick with players on the second unit who aren’t producing (eg Blunden)? Why was Burgdoerfer ever on the first unit? Why play McCormick so much? It’s these kinds of decisions that hurt the powerplay throughout the season. I mentioned back in November how effective the Lajoie-Jaros unit was on the powerplay (the former doing an excellent job at setting up the latter’s big shot, and both capable of carrying the puck up the ice effectively–one of Murray‘s biggest problems on the powerplay), but the duo rarely appeared.
Looking over the evolution of who was on the powerplay it’s possible to see the painfully slow realizations that Kleinendorst did make–in the last couple of months he shifted Murray away from the top unit, kept talented forwards like Chlapik on the first unit, and kept ineffective grinders like Blunden buried on the second. The reluctance to accept the evidence in front of him is Kleinendorst’s primary issue–the X’s and O’s of the powerplay aren’t an issue (there’s nothing fancy or flawed about the way the Sens used the umbrella), but how he used the personnel to execute them remained the problem. What’s mindnumbing is the endless tinkering with the special teams units–a successful group would be randomly changed and he showed great reluctance to ever go back to an original formation–as few goals as the powerplay scored they were produced by a bewildering number of different combinations.
Penalty Kill (77.0%)
Here, the org must have believed, they would see some improvement over last season. Randy Lee doubled down on grinding players–“good in the room” guys like Tyler Randell, Erik Burgdoerfer, Patrick Sieloff, etc, and when the chips were down…it was awful. The PK was terrible throughout the season with only a few players truly helping the situation. Here are the monthly numbers:
October: 39-47 82.9%
November: 41-54 75.9%
December: 42-56 75.0%
January: 38-51 74.5%
February: 34-42 80.9%
March: 37-48 77.1%
April: 21-26 80.7%
The usage/effectiveness numbers:
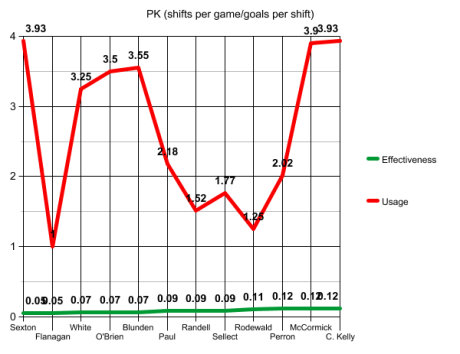
While the defense isn’t that far off what you’d expect given their results there are obvious issues with the forwards. Org sweetheart McCormick, along with sentimental addition of Chris Kelly, weren’t effective despite how much they played. Other than Sexton the other three most effective PK forwards (White, O’Brien, and the oft-injured Flanagan) were not played commensurate with their performance. O’Brien‘s numbers are particularly surprising since, 5-on-5, Kleinendorst couldn’t get enough of him (see below).
For those who haven’t seen them play, Blunden and late-season addition Selleck can’t skate, so having them on the PK (sometimes as a duo) was a nightmare to watch. Their numbers aren’t as awful as they should be because of protective pairings along the way (talented players like White and Sexton doing the work for them).
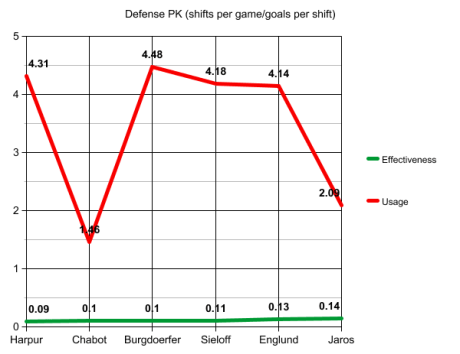
This is one area where Kleinendorst didn’t adjust to match reality–he kept throwing out the same personnel regardless of the result–relying on veterans and “grit”. The only system tweak that occurred began in January when he started playing his D-pairing the entire PK (or nearly all of it). This didn’t appreciably help, but he kept at it until April when he threw everything into the blender.
It’s hard to tell from the graph, but the kiss of death on the PK came in the form of Andreas Englund. The big Swede was actually on-ice for the most goals against (by a considerable margin) and he sewered Sieloff‘s numbers towards the end of the season (up until March he was well ahead of all defensemen in goals-per-shift). Burgdoerfer looks better than he was (conversely) because he generally benefited from playing with a superior partner. Just for the sake of clarity, here are the actual on-ice goals against numbers (with games played):
Englund: 38-69
Burgdoerfer: 31-66
Sieloff: 28-58
Jaros: 13-44
Harpur: 8-19
Murray: 5-58 (not included above due to low volume of play)
Lajoie: 3-56 (ibid)
Chabot: 2-13
Erkamps: 2-46 (ibid)
5-on-5
Here we are at how the majority of hockey games are played: even strength. My interest is player usage–how players were used in the lineup. In the absence of the AHL tracking ice time we are left with line combinations which, by and large, Kleinendorst stuck too (he rarely juggled his lines in-game). While I’ll have individual player breakdowns in Part Three, I did want to go over which players were used on various lines to give a sense of how Kleinendorst distributed his ice time.
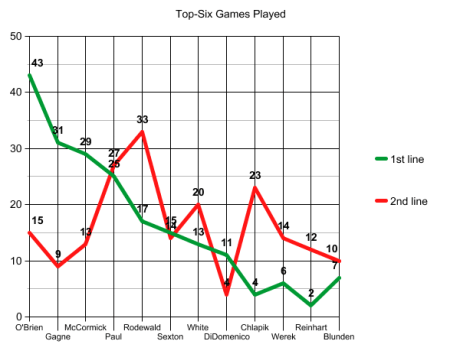
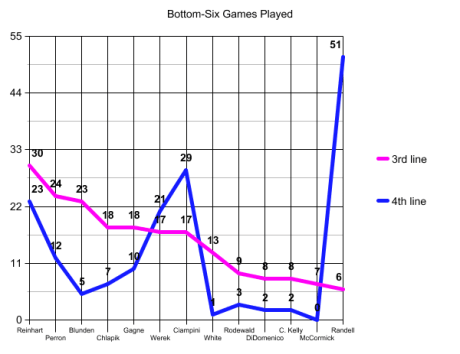
There is a lot to unpack here. Why sign AHL free agents to play them on the fourth line? Randy Lee spent good money on Randell and Reinhart and having them flail about in the bottom-six did nothing to help the team. Why are prospects like Gagne and Perron wasting their development time on the fourth line? On the other side of things, why aren’t White and Chlapik spending all their time in the top-six? 43-games of Jim O’Brien as your first-line center is a bad joke–at no time in his career at any level did he warrant shifts on the first-line–he’s not that kind of player (he’s a solid top-nine AHL-forward who can kill penalties–that’s it). Whatever anyone thinks of Jack Rodewald why the guy was stapled to the top-six for most of the year despite lengthy droughts in production is a head-scratcher. Why was Blunden ever in the top-six? It goes on and on. All of this is due to Kleinendorst’s conservatism–trusting players he knows, trusting veterans, and taking forever to wake up to the results of doing so (no doubt his reluctance being applauded by his clueless GM).
Things were a little different on defense, where the pairings are a bit more important than just ice-time in terms of performance. I’ll have individual breakdowns in Part Three, but in broad strokes, these were the most common combos this season:
Englund-Jaros (28 games)
Murray-Erkamps (21 games)
Sieloff-Burgdoerfer (20 games)
Lajoie-Murray (16 games)
Lajoie-Burgdoerfer (15 games)
Englund-Burgdoerfer (13 games)
Sieloff-Pokka (11 games)
Sieloff-Harpur (11 games)
What’s interesting was Kleinendorst’s disinterest in trying to protect young players with veterans–instead, he insulated his favourites (particularly Sieloff) with talented players. Most of the PTO’s were shuttled off to play with Erkamps–essentially loading up the bottom pairing with disaster. It’s a puzzling approach unless you’re happy with rotating two pairs which, sometimes, Kleinendorst did. There was certainly no consideration given for loading up a pairing offensively–we only saw Chabot-Jaros once, and Lajoie-Jaros/Lajoie-Pokka four times each (Harpur only played with the favourites). This mindnumbing adherence prevented what could have been a more dynamic back-end, rather than Englund endlessly banking pucks off the boards or Burgdoerfer‘s hilarious and incessant turnovers.
Fear. That’s what I took away from Kleinendorst this season. He’s a man motivated by a fear of mistakes–a fear of losing–which ironically has made him prone to both. Remove his Calder Cup season (2010-11) from his recent coaching record and this is what we get (via win percentages):
2011-12 Binghamton .428 (left for the NCAA)
2012-13 Alabama-Huntsville .140 (fired)
2013-14 Iowa .441
2014-15 Iowa .167 (fired)
2015-16 ERC Ingolstadt (mid-season replacement) .578
2016-17 Binghamton .395
2017-18 Belleville .414
Other than his brief foray in the DEL he’s had horrendous seasons wherever he’s gone and at this stage you have to call it like it is: he’s not a head coach–not at the AHL level at least. His slowness to react to what works and overdependence on certain players leaves him susceptible to the problems we’ve seen with the BSens.
In Part Three we will dissect the performances of individual players. I’ll go over their general strengths and weaknesses, what they did, with whom, what I’d do with them as an asset and then what I expect Randy Lee/Pierre Dorion to do.
A final note to bring attention to my patreon and donations in general. I’ve been writing about the Sens for eleven years now (seven on this platform). The work, especially with the BSens, is unique and requires a huge investment in time and analysis. I do it because I’m passionate about it, but it requires purchasing AHL Live (not worth it for any other reason) as well as my personal time–any and all support really helps me continue to do what I’m doing. Thanks to those who have supported me in the past–its greatly appreciated!
This article is written by Peter Levi (@eyeonthesens)
![]()
